TheoLt Release 10 is GO!

Watch this space for full details of the updates, the improvements and how-to’s !

Existing users should contact us now for update details.

TheoLt, TheoLt Contour and TheoLt Tools now improve the productivity of BricsCAD to V17 and AutoCAD to Release 2017 for anyone using Total Station, Laser Distance Meters or Laser Scan Data for the productions of plans or elevations.

VirtuSurv Webinar

Webinar introducing functionality of kubit VirtuSurv, high resolution scan data in a simple to use, virtual surveying environment. Connect to any CAD interface including AutoCAD, AutoCAD LT and IntelliCAD. Connect to any Windows based program (Excel, Word and more). Make use of 3D laser scan data without the need for a high level of technical skill. Perform traditional survey from your office.

Ortho Image from PointCloud’s

Following on from our previous post announcing PointCloud Release 7, here is a video showing one of the new (and probably most useful) functions.

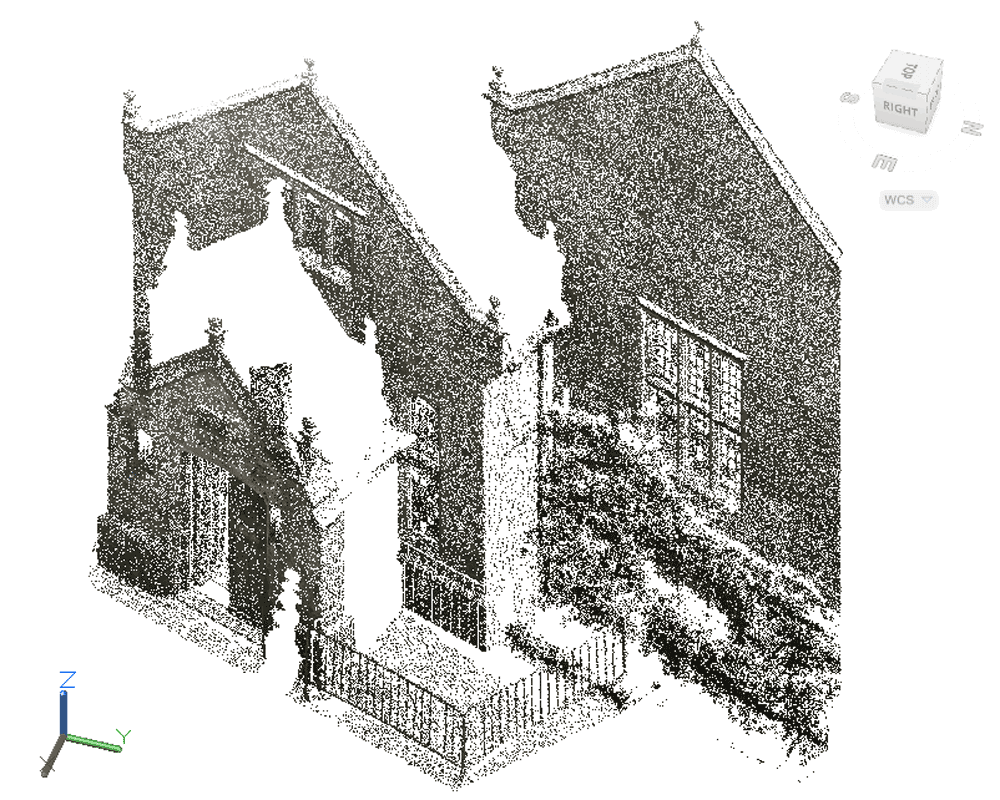
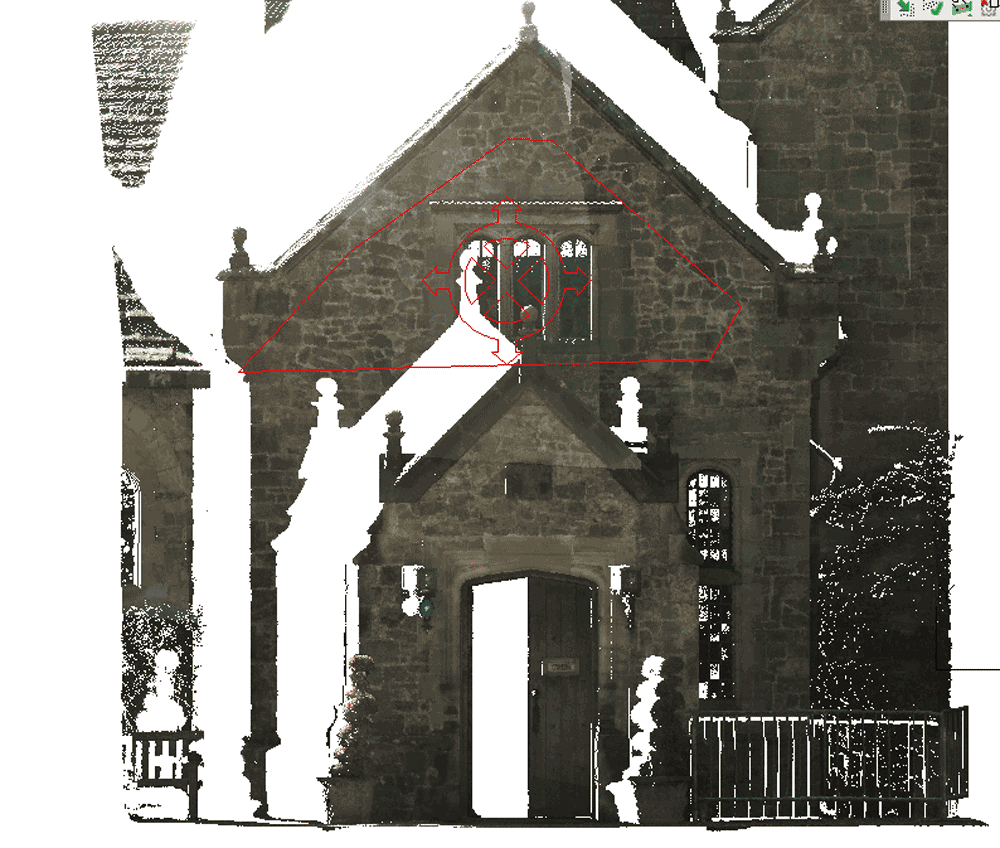
Then ortho image is easily created from a laser scanned point cloud in AutoCAD. The image is to scale and can be imported to any program that handles raster images. Draw easy elevations, great for printing or annotating for a deliverable. Contact us for more information.

PhoToPlan 7 is now available

We are pleased to announce that the latest version of kubit’s PhoToPlan software for AutoCAD is now available for download.

The new features include:

  • Support of AutoCAD 2012 and Autodesk products based on AutoCAD 2012.
  • New higher level product “PhoToPlan Ultimate”.
  • Generation of Ortho Photos from orientated images. Included in the “Ultimate” variant only.
  • Fit cylinder with just a few clicks in two orientated images. no need for marked points on the cylinder . Included in the “Pro” and “Ultimate” variants.
  • “Flatten drawing“ – project geometry to a UCS. For delivering 2D drawings from 3D wireframe.
  • “Unwrap Cylinder” – from at least one orientated image and points on the cylinder PhoToPlan will create a flat image of the surface of the cylinder. Included in the “Ultimate” variant only.

  • Create UCS from the “Dual image Draw” commands. Once defined, facades may be digitised using only a single image and with fast commands for switching between parallel planes using images only, digitising of elevations has been significantly  speeded up.
  • Improvements to the image orientation workflow. Controlling the viewports and view is vital for fast modelling. Release 7 eases this with a number of new commands.
  • Support for “Ribbons” in AutoCAD 2010 to 2012: an alternative for the classic menu and toolbars (actually takes less space than showing all toolbars)


PhoToPlan Release 7 supports All 32 bit and 64 bit versions of Windows 7, Vista and XP (Windows 2000 is no longer supported).

Each of these new features will be examined in forthcoming posts.

Release 7 is provided free of charge to existing users on subscription but please remember to request your upgraded license before installation.

A free of charge trial may be downloaded here.

PointCloud 7 is now available

We are pleased to announce that the latest version of kubit’s PointCloud software for AutoCAD is now available for download.

The new features include:

  • Support of AutoCAD 2012 and Autodesk products based on AutoCAD 2012.
  • New product family “PointSense”. The first of this new family will be released in the UK in July. “PointSense Plant” is a catalog driven plant modelling tool that identifies pipe fittings from a catalog and matches them to the cloud.
  • Generation of Ortho Images from point clouds including “X-Ray”. Included in the “Basic” and “Pro” variants images may be created which could enable off-line tracing of detail to create 2D drawings.
 
  • Fit cylinder with just two clicks (AutoCAD 2010 and higher). A faster and easier method to fitting pipes than previous releases.
  • “Flatten drawing“ – project geometry to a UCS. For delivering 2D drawings from 3D wireframe.
  • “SmartSection” for detailed display of AutoCAD point clouds (PCG). One of the disadvantages of the PCG engine in AutoCAD is the density of the point display. Smart sections enable the current working section of the cloud to be displayed in it’s full density.
  • Improvements to the image orientation workflow. Controlling the viewports and view is vital for fast modelling. Release 7 eases this with a number of new commands.
  • Support for “Ribbons” in AutoCAD 2010 to 2012: an alternative for the classic menu and toolbars (actually takes less space than showing all toolbars)


PointCloud Release 7 supports All 32 bit and 64 bit versions of Windows 7, Vista and XP (Windows 2000 is no longer supported).

Each of these new features will be examined in forthcoming posts.

Release 7 is provided free of charge to existing users on subscription but please remember to request your upgraded license before installation.

Elevation Views in AutoCAD

One of the most frequently asked questions by TheoLt users is:

‘How do I get an elevation view of the building I’m measuring?’

TheoLt sends 3D data to AutoCAD which is plotted in the lines and layers of your choice. It is useful to be able to vew the drawing as a façade. One method to achieve this is to use AutoCAD’s UCS (User Co-ordinate System) command to set up a façade UCS and view it square on. The 2 key commands are ‘UCS’ and ‘PLAN’. This example is a job started in WCS:

1. Place a polyline across the plan by snapping to the ends of a measured line (because this will guarantee the UCS will be true level) It’s the red line across the facade here:

2. Fix a UCS to the polyline. Use the UCS ‘e’ option (for ‘entity’ or ‘ob’ for object in late versions) to pick the polyline when prompted. Use ‘Plan’ to get a plan view of the new UCS.

3. Rotate the UCS about the required axis by 90 deg to point the Z axis at the viewer of the façade. This is done by entering ‘UCS’ on the command line and then the axis of roatation (x, y or z) then the angle, the default is 90deg. Watch the UCS icon to see what is happening.

4. Use ‘plan’ to get a plan view of the new UCS

5. (optional) Use UCSICON command to set ‘Noorigin’ to get the icon out of the way..

6.Save the UCSwith an apropriate name (‘Front’ ‘Back’ North ‘Elavation’ etc)  with the ‘S’ option at the UCS command for future use.

Enjoy your facade view!

TheoLt will plot lines true to the instrument orientation in AutoCAD regardless of the UCS. View-ports in model space can be used to run plan and elevation drawings at the same time. The façade UCS is also useful when setting up views of the 3D data for elevation drawings.

You can also use the AutoCAD ‘View’ command to save views too as a short cut to getting back to a view you like. Once the façade view is as desired it can be named for future use.

Tip: I find it helps to use your hand in the same way as we did to learn Flemmings Left hand rule (assuming you have your mouse in your right hand!)  in physics at school to work out the required axis of rotation at 3:

This is a useful method of setting up a facade UCS if your job isn’t aligned to the WCS : don’t forget TheoLt’s Default Orienation option to orient aligned with a plane which is great for quick starts aligned to a facade.

PhoToPlan3D: Understanding precision

PhotoPlan3D= Simple photogrammetric plotting in AutoCAD!

PhoToPlan3D by kubit makes 2 useful aspects of photogrammetry available for AutoCAD users: 1st  plotting from 2 (or more) images by intersection in 3D and 2nd plotting by projection from single images on to a plane. When used together the PhotoToPlan3D toolset enables the use of non metric imagery for surprisingly good results as a data source in AutoCAD.

Ther are 3 main aspects to getting the best out of PhoToPlan 3D: Control, Image condition and image orientation.

The first thing is to get a grip on is the relationship between the image and the control required to orient it. Let’s look at the control 1st.

The distribution of control points should be as wide as possible but should not rely on clusters in the centre of the area to be mapped. The number of control points is on the high side if you are used to using the minimum of 4 in PhoToPlan2D, the minimum of 9 points seems to be a bit tiresome but the benefits of the higher density of control will be worth it! If you imagine the task as filling a ‘data hole’  a good distribution of points would be not only around the edges of the hole but in the hole itself too! There are 3 basic rules on control points:

1. The more the merrier, 9 points per image is the minimum!

2. A wide distribution is better than not and

3. The closer to the data area the better

The condition of the imagery has a big effect on the precision achievable; this can be characterized in 4 elements:

1. The disposition of the images. If the images are captured from camera positions too close together or too far apart the intersection of rays between them and the object space will be either too obtuse or too accute, it helps to think in terms of a 90 to 60 degree intersection as ideal. If the stand-off from the camera to the subject has too great a variance the results will be poor. PhoToPlan3D will give you results from poorly conditioned imagery but the precision will proportionally poor too! Big X,Y rotations between images are not a problem although its helpful to resolve this at insert.

2. The convergence of the images. You will get nowhere if the images are not covering the subject area! Also if they point at the subject too obliquely you will find it hard to find common points between the images when plotting.

3. The consistency of the images. Ideally image pairs should be from the same camera and lens. It’s difficult (but not impossible) to achieve good intersections when one image is taken with a wide angle lens and the next with a telephoto.

4. Camera calibration information. If camera calibration data is available it should be used; PhoToPlan3D works with an ‘inverse’ calibration based on an assumed focal length, if the true focal length can be used the precision is better.  Relying on the image EXIF data is not enough.

Image condition: this is a poor case as there is not only a big’ Z’ shift, but also severe tilt between the 2 images.


The quality of the image orientation depends on a combination of the image condition and the control quality. The image orientation panel is very flexible and it can be used to experiment with control point configurations point by point to see what gives the best result.

The image orientation panel. You can add more control points, take them in and out of the calculation and see the worst case point at any time after adding the 1st 9 points.

It’s worth noting that the constellation of control points used will change as new points are added, the precision (as reported by the standard deviation) may well decrease beyond a certain number of points and the reported worst case point will change: experimentation here pays off. The effect of adding new points can be to dilute the precision!

Tip if you are using imperial units in AutoCAD the ‘Deviation’ results will not be easy to read as the scores will be fractions of an inch. Set the AutoCAD units to decimal with at least 4 decimal places to see the scores!

Refining the image orientation The initial 9 points for the first image may be the only points you have but if you are working with a point cloud or existing 3D survey data its well worth adding more points and testing  which configuration of points works best. Its simply a case of holding off hitting the ‘Create orientated image’ button until the standard deviation is as low as possible.

Let’s look at the orientation procedure in detail:

The image pair and the control: in this case the control is from an existing survey A number of control points have been marked ready for image orientation. (data suppled by English Heritage, used with permission)

With the 2 images loaded on a convenient UCS and the control points marked the next step is to open the  Image Orientation panel and begin to add control points to the orientation, this is done by point matching between the image and the control.

Tip: the deviation scores are not displayed until the destination image name has been set.

Adding control points to the orientation.

Note on precision: The standard deviation (SD) refers to the performance of the fit between the image and the control geometry. If the SD of two  image orientations is 1cm each it can be expected that the resultant precision when plotting between then will be roughly double the SD i.e: 2cm per point.

The orientation will complete with the Create orientated image function and it is presented in CamNav view:This example is a good one to look at the registration across the image area. The control points are mostly in the centre and left side of the image, the fit is poor around the edges ( particularly at the apex of the pediment on the right). The distribution of control points could be better!

Reducing the plan rotation  in the pair improves precision. By increasing the density of control points and choosing images with less tilt between them the precision is improved but the quality of the pair in terms of parallelism with the subject seems to have a big impact on the precision of digitised lines. Here I have loaded 2 images with more vertical displacement but less convergence :Despite the deep Z shift between them these two images have a better parallelism. The orientation SD was refined by selecting 18 points and deactivating the worst fit point and then adding new points (this worked better than juggling the relative fit of the 1st 18) the SDs came in at 10 and 9mm. Here are 2 pairs with different characteristics:

The relative plan rotation of the images seems to be more important then the tilt or depth displacement. Surprisingly in the 2 pairs above I got far better results with pair 1 than pair 2, pair 2 is a significantly convergent case whereas pair 1, despite the big Z shift and vertical tilt has better parallelism.


By repeating the image orienatation and testing lines (in blue in the screen shot) against the control point psositions I can gain confidence in the pair. Pair 2, despite comfortable SD scores  (11 and 12mm), plots consitently dispalced by 2-3cm.

The difference in the performance of the 2 pairs can be explained by the planar orientation; the best pair were taken in parallel and worked well even though they have a big stand off variation.

It’s a good idea to experiment to find the best image condition. One of the  great strengths of PhoToPlan 3D is the flexibilioy you have to try things out and see what the resukts are like before you commit to plotting. Having got the orientation refinement method practised and making sure there is an abundance of control and imagery available means the optimum image condition can be found. The classic 3X3 rules (contained in this pdf) still hold for photogrammetric capture but it seems that PhoToPlan3D works best with near ‘square on’ imagery!
Pointclouds in AutoCAD 2011

One of the (much hyped) new features of AutoCAD 2011 was the inclusion of handling pointcloud data. In this post we will take a quick look at this functionality and how you can make real use of this.

The first issue is that AutoCAD can only read specific (limited) pointcloud formats; LAS, XYB and the 2 Faro formats FLS and FWS. Many users will find this a limitation and need further formats. Further formats may be imported by adding the free version of PointCloud from kubit. The product page is here and the software may be downloadedhere. PointCloud adds the formats PTZ, RiScan Pro and ASCII (CSV, TXT etc).

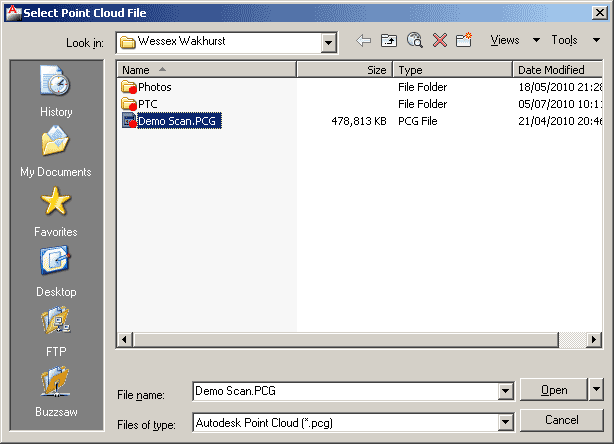
The workflow of importing pointcloud data is to first index the supplied file to create a PCG file which is Autodesk’s pointcloud format.

This PCG file may be attached in the same way as any other AutoCAD block or image file.
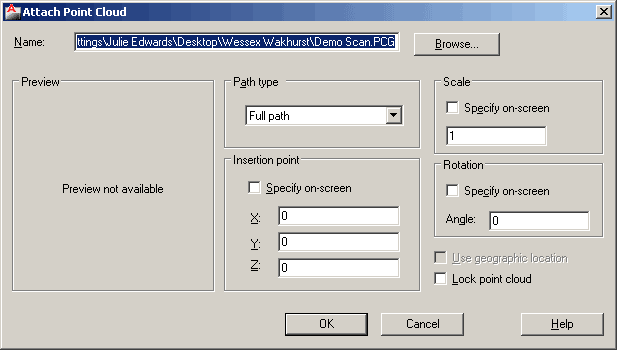
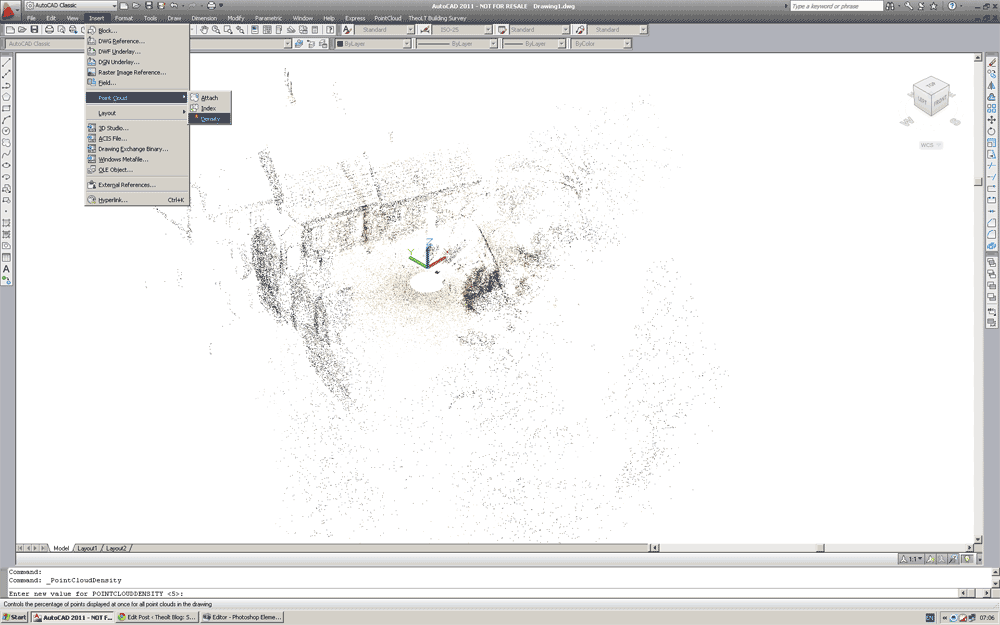
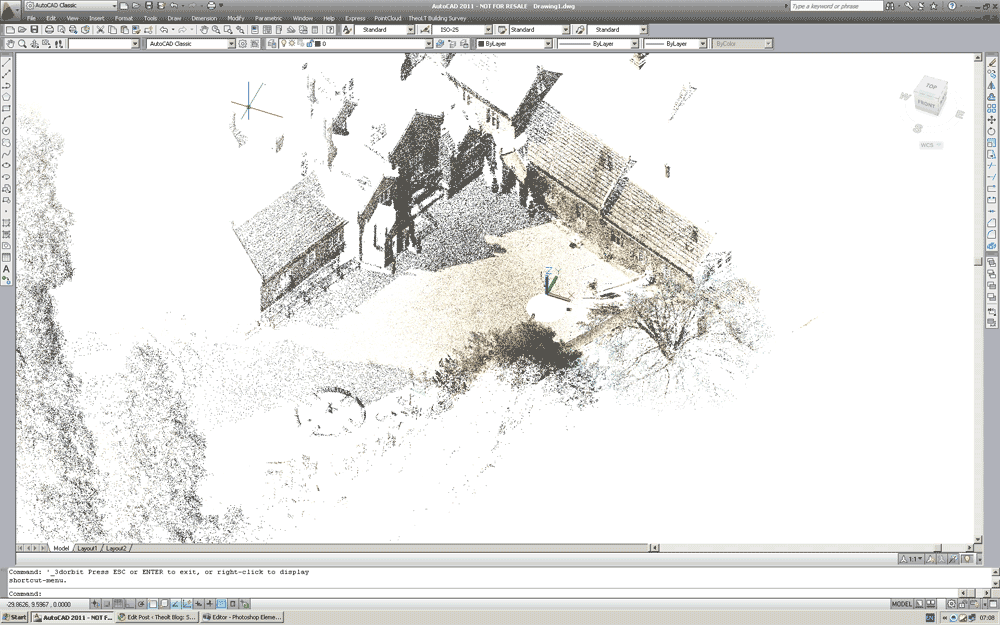
The method of display of the points depends on the current AutoCAD Visual Style. A 2D non-rendered (2D) style displays all of the points in a single colour: black. Selecting a rendered (shaded / 3D) style displays the points in colour.

AutoCAD manages the number of points displayed on the screen. At first loading the density of the points displayed may appear rather thin. Select the density command. Here I have set the value 70. The display is now far more usable. You will find the pan and orbit are very quick and all points within the cloud may be via the Node object snap.

Many will view the fact that AutoCAD can only display the whole cloud or no cloud as a major limitation, this is another limitation that may be bypassed with kubit’s PointCloud software although this further functionality requires the paid version.

PointCloud allows the definition of sections which may be managed in the section manager. These may be created in the following ways;

  • Slice
  • (Shift slice up/down and change slice thickness)
  • (Multiple slices: Parallel or perpendicular to objects/curves)
  • Clipping Box
  • Clipping Polygon (2D projection, inside or outside remains visible).

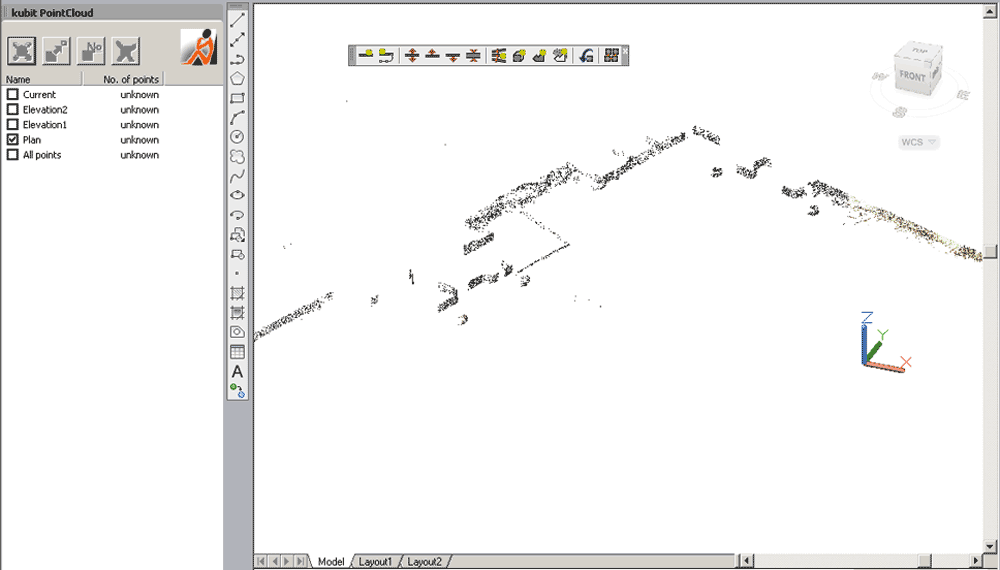
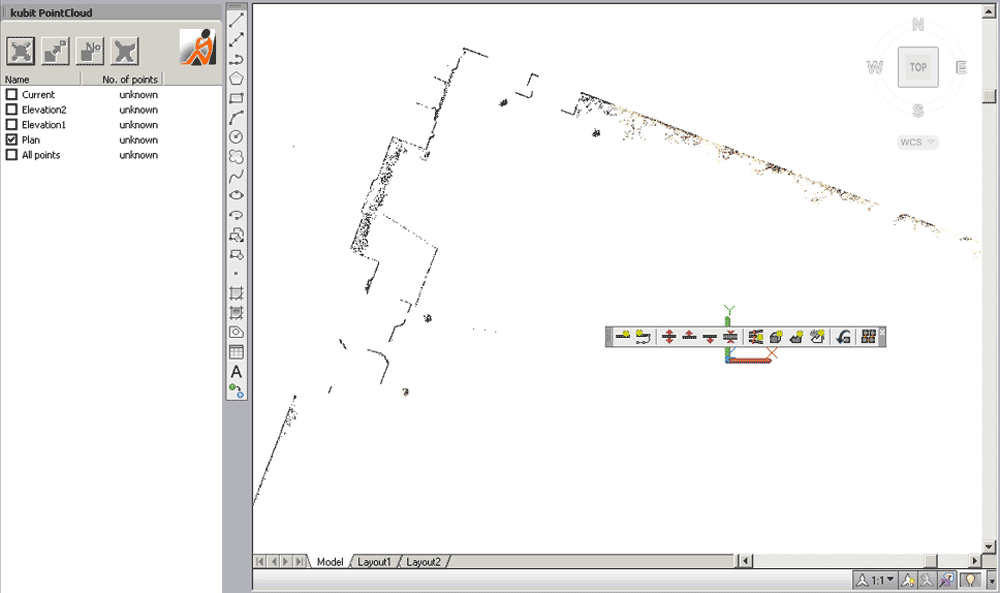
A typical use of the slice command is to create a plan.

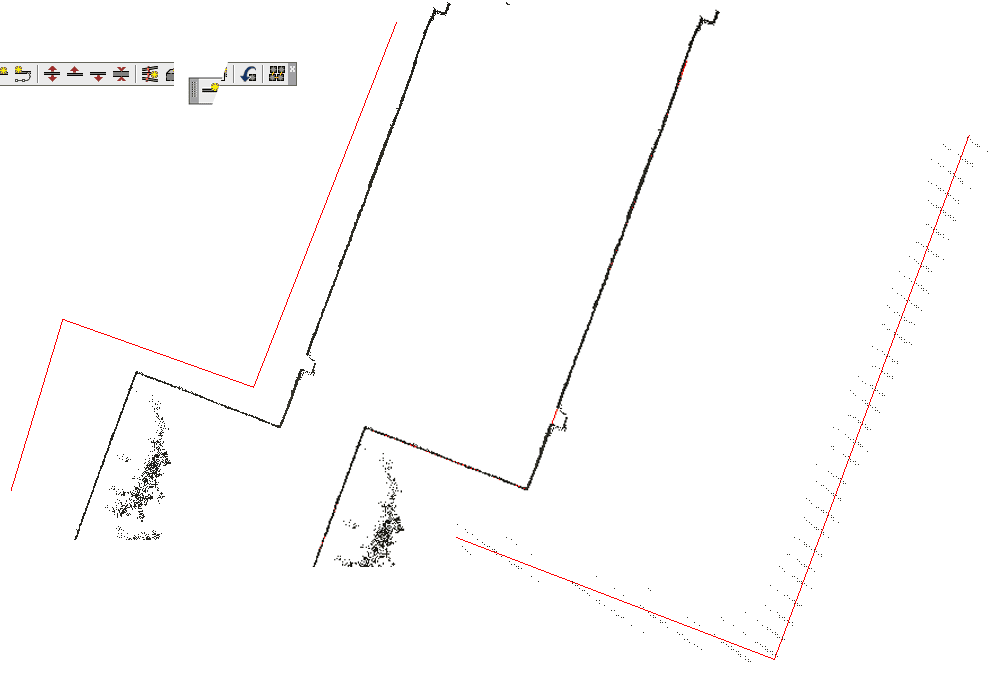
This of course may then be traced. If the version of PointCloud being used is the Pro version then the Automatic Fitting may be used to fit the plan to the slice. This is completed by drawing a very approximate polyline (with the correct number of corners) and selecting the Fit Polygon command.

Working with elevations is a key use of PointCloud data. This however shows another weakness in the AutoCAD  pointcloud display. The density of the data displayed may not be sufficient for tracing details.

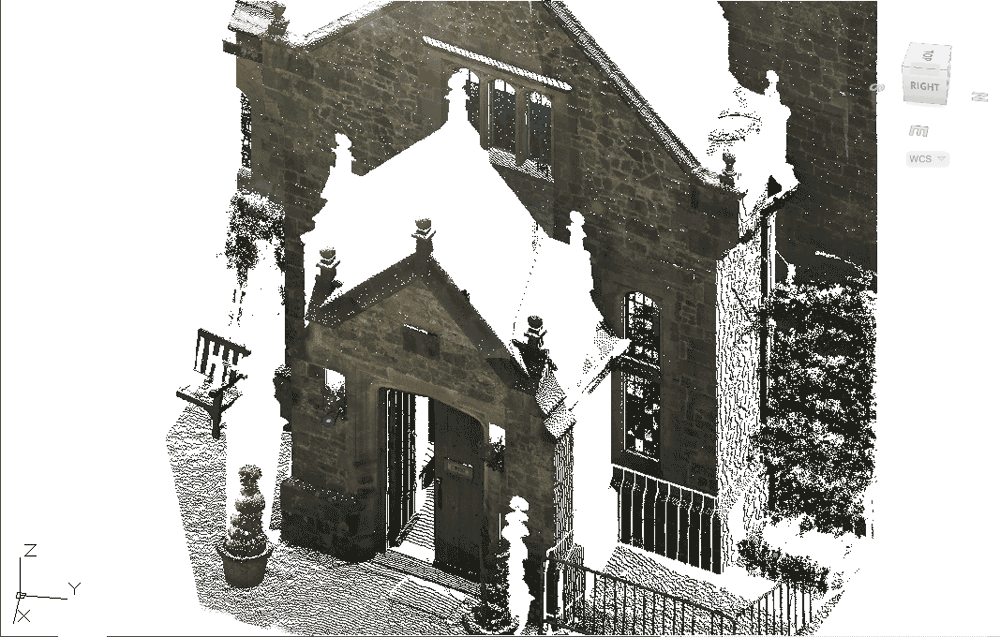
Again, PointCloud may come to the rescue here. Using the section manager individual sections of the data set may be saved in PTC format – the native format of kubit’s PointCloud (which enables the support for PointCloud data in AutoCAD’s prior to 2011). The display of the PTC is far denser allowing the details to be seen clearly.

Edit/Note: Release 7, released in May 2011 introduced “SmartSections” a new way of creating and working with this higher density display. The new SmartSections are faster and simpler to use. End Edit/Note.

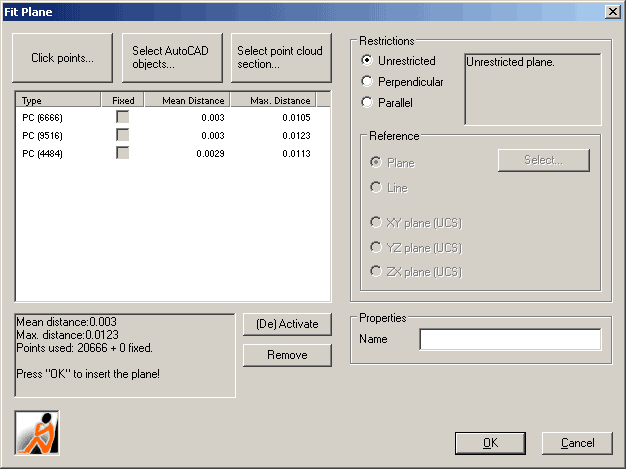
A further tool within PointCloud is Plane fitting. This enables a plane to be fitted to a number of points and in the case of elevations, the UCS placed on this plane ensuring the elevation is drawn in the correct position.

At first glance it may seem that are are too many disadvantages to using the Autodesk PCG engine and other tools provide a better solution. However when you consider that the PCG engine allows up to 2 billlion points to be inserted into AutoCAD I would suggest that PCG + PointCloud is the ideal tool to manage the dataset within AutoCAD, creating overall plans and views.  with sectioning the data to PTC sections for detail extraction. Take time to download and evaluate PointCloud, again details here.