TheoContour R10 is coming

No, we do not post often enough here.
No, we do not update our site enough.
Yes we need to work on this.
However you can be sure when we do post, it is important, it is interesting and it is new!

In this case what is new is TheoContour R10!

Its just a week or two away – we are just finishing off the installer and testing the installer.

What can you expect from the new release? You can expect what all software developers say their new releases contain:

  • More Power!
  • More Functions!
  • Easier to Use!Spline-smoothed-6_trimed

In this case it is true! TheoContour (we think) is one of the updates we are most proud of. The new features include:


  • New licensing System (easier to use, more reliable, better trial options).
  • PLY Import
  • Powerful Surface Smoothing Options
  • Powerful Line Smoothing Options
  • Better Layer Control
  • New Surface Creation Options with user definable colours.
  • Better memory management.

Surf ht shaded

Contact Us now for further details!

PointSense Seminar.

During the launch of the PointSense Plant product, kubit provided a number of seminars detailing the powerful features of this exciting tool. The webinars show the ease of accurate piping design in AutoCAD with the native PCG engine along with a great of variety of powerful tools working directly on the native PCG engine. The webinar has been divided into 4 sections of 15 minutes duration and should be watched in the following order:

Part 1:

Part 2:

Part 3:

Part 4:

Ortho Image from PointCloud’s

Following on from our previous post announcing PointCloud Release 7, here is a video showing one of the new (and probably most useful) functions.

Then ortho image is easily created from a laser scanned point cloud in AutoCAD. The image is to scale and can be imported to any program that handles raster images. Draw easy elevations, great for printing or annotating for a deliverable. Contact us for more information.

Multiple Slices and Polygon Fitting in PointCloud Pro

Kubit USA have been producing YouTube Videos showing many of the powerful features of PointCloud Pro for AutoCAD.

In this movie we automatically extract profile lines from a laser scanned tunnel using kubit PointCloud Pro for AutoCAD. Multiple slices are taken along a defined path and lines are fitted to the profile slices with the kubit “Polygon Fit” tool. These profiles can also be used easily to create a model using traditional AutoCAD modelling commands:


Kubit Partner Conference

Once a year the kubit resellers from around the world gather at kubit’s Dresden offices to review and discuss developments in surveying software and new products for the next year. I have just returned from the 2011 conference and am really pleased to report that the future of kubit software looks really promising. Both PhoToPlan and PointCloud have some new really powerful and important new tools that will help extract more information from the PointCloud or Photograph quicker and easier.

There will be many posts in the coming weeks and months to detail these improvements but briefly;

PointCloud: (both Basic and Pro) now include Orthographic Image Generation – a quick and easy to use tool that is ideal for extracting plans and elevations for tracing. There is also a new focus on industry specific tools – the first of these is PointSense Plant. PointCloud also benefits from the improvements to the pointcloud engine in AutoCAD 2012.

PhoToPlan: In addition to many workflow improvements, the tool will also feature a new ortho image  tool – generating Orthographic Photographs from the combination of geometry (or pointclouds) and orientated images.

Detailed announcements will be made soon.

Pointclouds in AutoCAD 2011

One of the (much hyped) new features of AutoCAD 2011 was the inclusion of handling pointcloud data. In this post we will take a quick look at this functionality and how you can make real use of this.

The first issue is that AutoCAD can only read specific (limited) pointcloud formats; LAS, XYB and the 2 Faro formats FLS and FWS. Many users will find this a limitation and need further formats. Further formats may be imported by adding the free version of PointCloud from kubit. The product page is here and the software may be downloadedhere. PointCloud adds the formats PTZ, RiScan Pro and ASCII (CSV, TXT etc).

The workflow of importing pointcloud data is to first index the supplied file to create a PCG file which is Autodesk’s pointcloud format.

This PCG file may be attached in the same way as any other AutoCAD block or image file.

The method of display of the points depends on the current AutoCAD Visual Style. A 2D non-rendered (2D) style displays all of the points in a single colour: black. Selecting a rendered (shaded / 3D) style displays the points in colour.

AutoCAD manages the number of points displayed on the screen. At first loading the density of the points displayed may appear rather thin. Select the density command. Here I have set the value 70. The display is now far more usable. You will find the pan and orbit are very quick and all points within the cloud may be via the Node object snap.

Many will view the fact that AutoCAD can only display the whole cloud or no cloud as a major limitation, this is another limitation that may be bypassed with kubit’s PointCloud software although this further functionality requires the paid version.

PointCloud allows the definition of sections which may be managed in the section manager. These may be created in the following ways;

  • Slice
  • (Shift slice up/down and change slice thickness)
  • (Multiple slices: Parallel or perpendicular to objects/curves)
  • Clipping Box
  • Clipping Polygon (2D projection, inside or outside remains visible).

A typical use of the slice command is to create a plan.

This of course may then be traced. If the version of PointCloud being used is the Pro version then the Automatic Fitting may be used to fit the plan to the slice. This is completed by drawing a very approximate polyline (with the correct number of corners) and selecting the Fit Polygon command.

Working with elevations is a key use of PointCloud data. This however shows another weakness in the AutoCAD  pointcloud display. The density of the data displayed may not be sufficient for tracing details.

Again, PointCloud may come to the rescue here. Using the section manager individual sections of the data set may be saved in PTC format – the native format of kubit’s PointCloud (which enables the support for PointCloud data in AutoCAD’s prior to 2011). The display of the PTC is far denser allowing the details to be seen clearly.

Edit/Note: Release 7, released in May 2011 introduced “SmartSections” a new way of creating and working with this higher density display. The new SmartSections are faster and simpler to use. End Edit/Note.

A further tool within PointCloud is Plane fitting. This enables a plane to be fitted to a number of points and in the case of elevations, the UCS placed on this plane ensuring the elevation is drawn in the correct position.

At first glance it may seem that are are too many disadvantages to using the Autodesk PCG engine and other tools provide a better solution. However when you consider that the PCG engine allows up to 2 billlion points to be inserted into AutoCAD I would suggest that PCG + PointCloud is the ideal tool to manage the dataset within AutoCAD, creating overall plans and views.  with sectioning the data to PTC sections for detail extraction. Take time to download and evaluate PointCloud, again details here.

TheoLt: Powerful Flexible Features.

One of the great advantages of TheoLt compared to other survey software is it’s complete flexibility.  For example, lets take a look at the “Features Library”.

The basic premise of TheoLt is that it transfers the measurement information or point from a survey instrument (or Distance Meter) to CAD to be used by any command  (for example, draw lines, insert blocks etc). What the TheoLt Features Library enables is for a series of measurements to be combined to insert a series of lines, arcs or attributed blocks (much like standard survey “feature coding”).

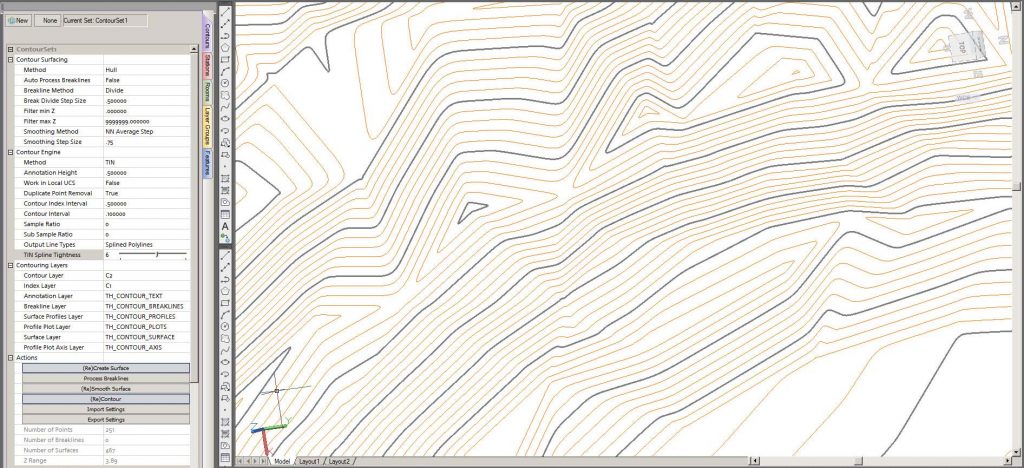
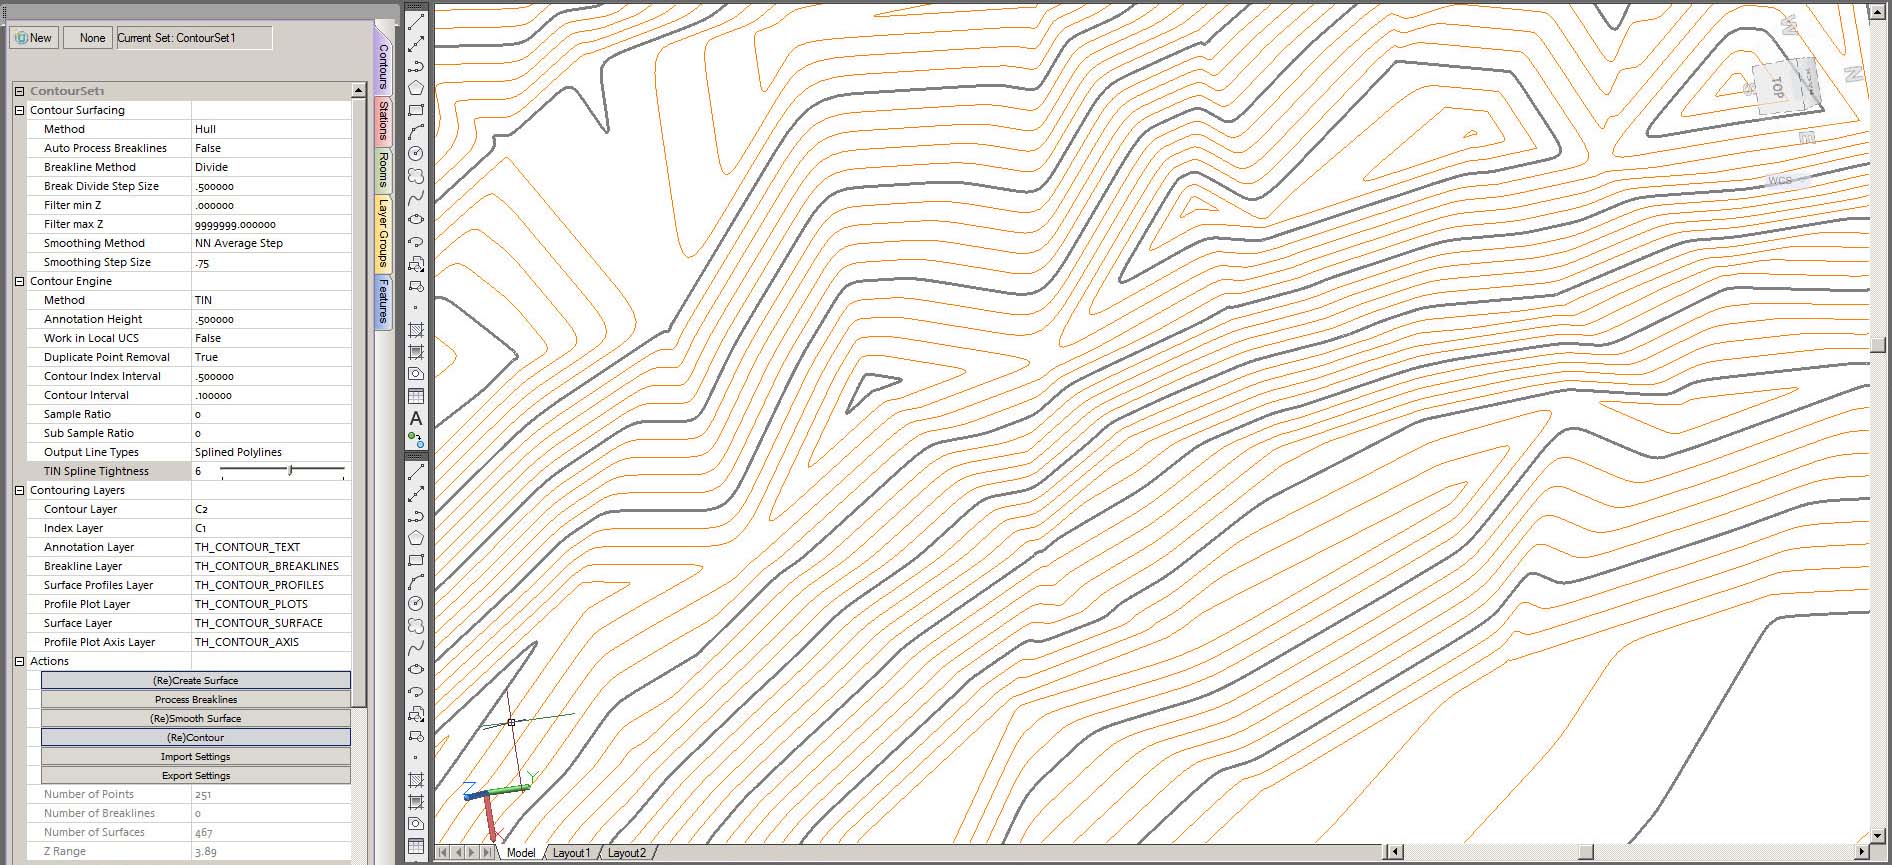
The feature definitions are accessed through the the settings dialog in the main TheoLt window. Definitions are grouped into folders.

Looking at it’s simplest use, inserting a single attributed block as a detail point. The first stage is to name the feature , define it’s icon and the number of measurements that should be taken to insert the feature. In this case, a single 3D measurement.

The next stage is to define any user attributes that may be required and whether confirmation is required (asking the user to confirm the values). Finally select the block to be inserted.

Once defined, opening the features panel will show the newly created item and a single click on the apropraite icon in the feature  palette will prompt for the measurement and the block will be inserted.

Next we can look at a more complex but typical use; kerbs tops and bottom in topographic survey. The aim here is to pick points on the top and the bottom of the kerbs, connecting the points, inserting blocks and annotating levels. This is very typical of topographic survey. Our definition will be point on top of kerb, point on bottom of kerb before moving on to the next part of the kerb.

Defining the feature, we name it and use 2 3D measurements with correct prompts. As we wish to join the points with lines, we will select “repeat insert” and join points on Layer (each point type having it’s own layer). This will allow the lines to be continued for as many measurements as required before exiting the command.  The attributes will be the Z-level of the first point only and two blocks will be inserted, each on it’s own layer.

Now when selecting the feature from the palate, the measurements are prompted, blocks are inserted and then the first prompt starts again. After the next round of observations, lines are drawn between the respective points on their designated layers. Options allow the lines to be curved, straight  and the alignment of the annotation to be altered or disabled.

The final example is a single complex item; a tree. To measure one fully quite a few measurements are required; the centre of the main trunk, the girth of the trunk, horizontal extent of the canopy and finally the vertical extent (height). These can be defined in the first window with prompts and measurement types. I would assume that for the first measurement the operator would take the angle to the centre of the trunk before taking the distance to the centre. This would leave the instrument pointing to the extent of the girth which we can collect as an angle only measurement. We can also choose to write the details out to a file which can contain any of the collected data fields for processing.

Next we will create the attributes where we will also collect the tree type which will be stored in a list to speed up the user input.

Finally we insert a block to represent the trunk – scaled to match the girth. A second block will be inserted, scaled to math the canopy.  An attributed block is inserted to hold the details of the tree (in addition to the file written above).

Obviously, this is not an in-depth analysis of what is possible from the features palate but I hope it gives some indication of the power within TheoLt.